Learning analytics
Your audience is talking to you every day. Every course they finish, every video they replay, every question they ask, every topic they abandon — that is your people telling you what they need in order to grow.
Learning analytics is, simply, learning to listen.
Understanding your audience's behavior
Training numbers are not bureaucracy. They are human behavior in the shape of data.
What are people searching for? That tells you what they want to learn. Where do they pause and replay? That tells you what they find hard. What do they finish with enthusiasm? That tells you what works for them.
Listen to behavior → understand → create the right learning opportunity.
Five signals worth watching every week
From measuring to improving: the virtuous cycle
Create, distribute, measure, improve. Most programs stop at measuring. The value is in completing the loop: using what you measure to create the next learning opportunity.
Every turn of the loop makes your training better. Analytics is the engine.
In practice, closing the loop means three simple decisions every month: which course to reinforce because it's working, which course to redesign because the data shows friction, and which course to create because the demand is already visible.
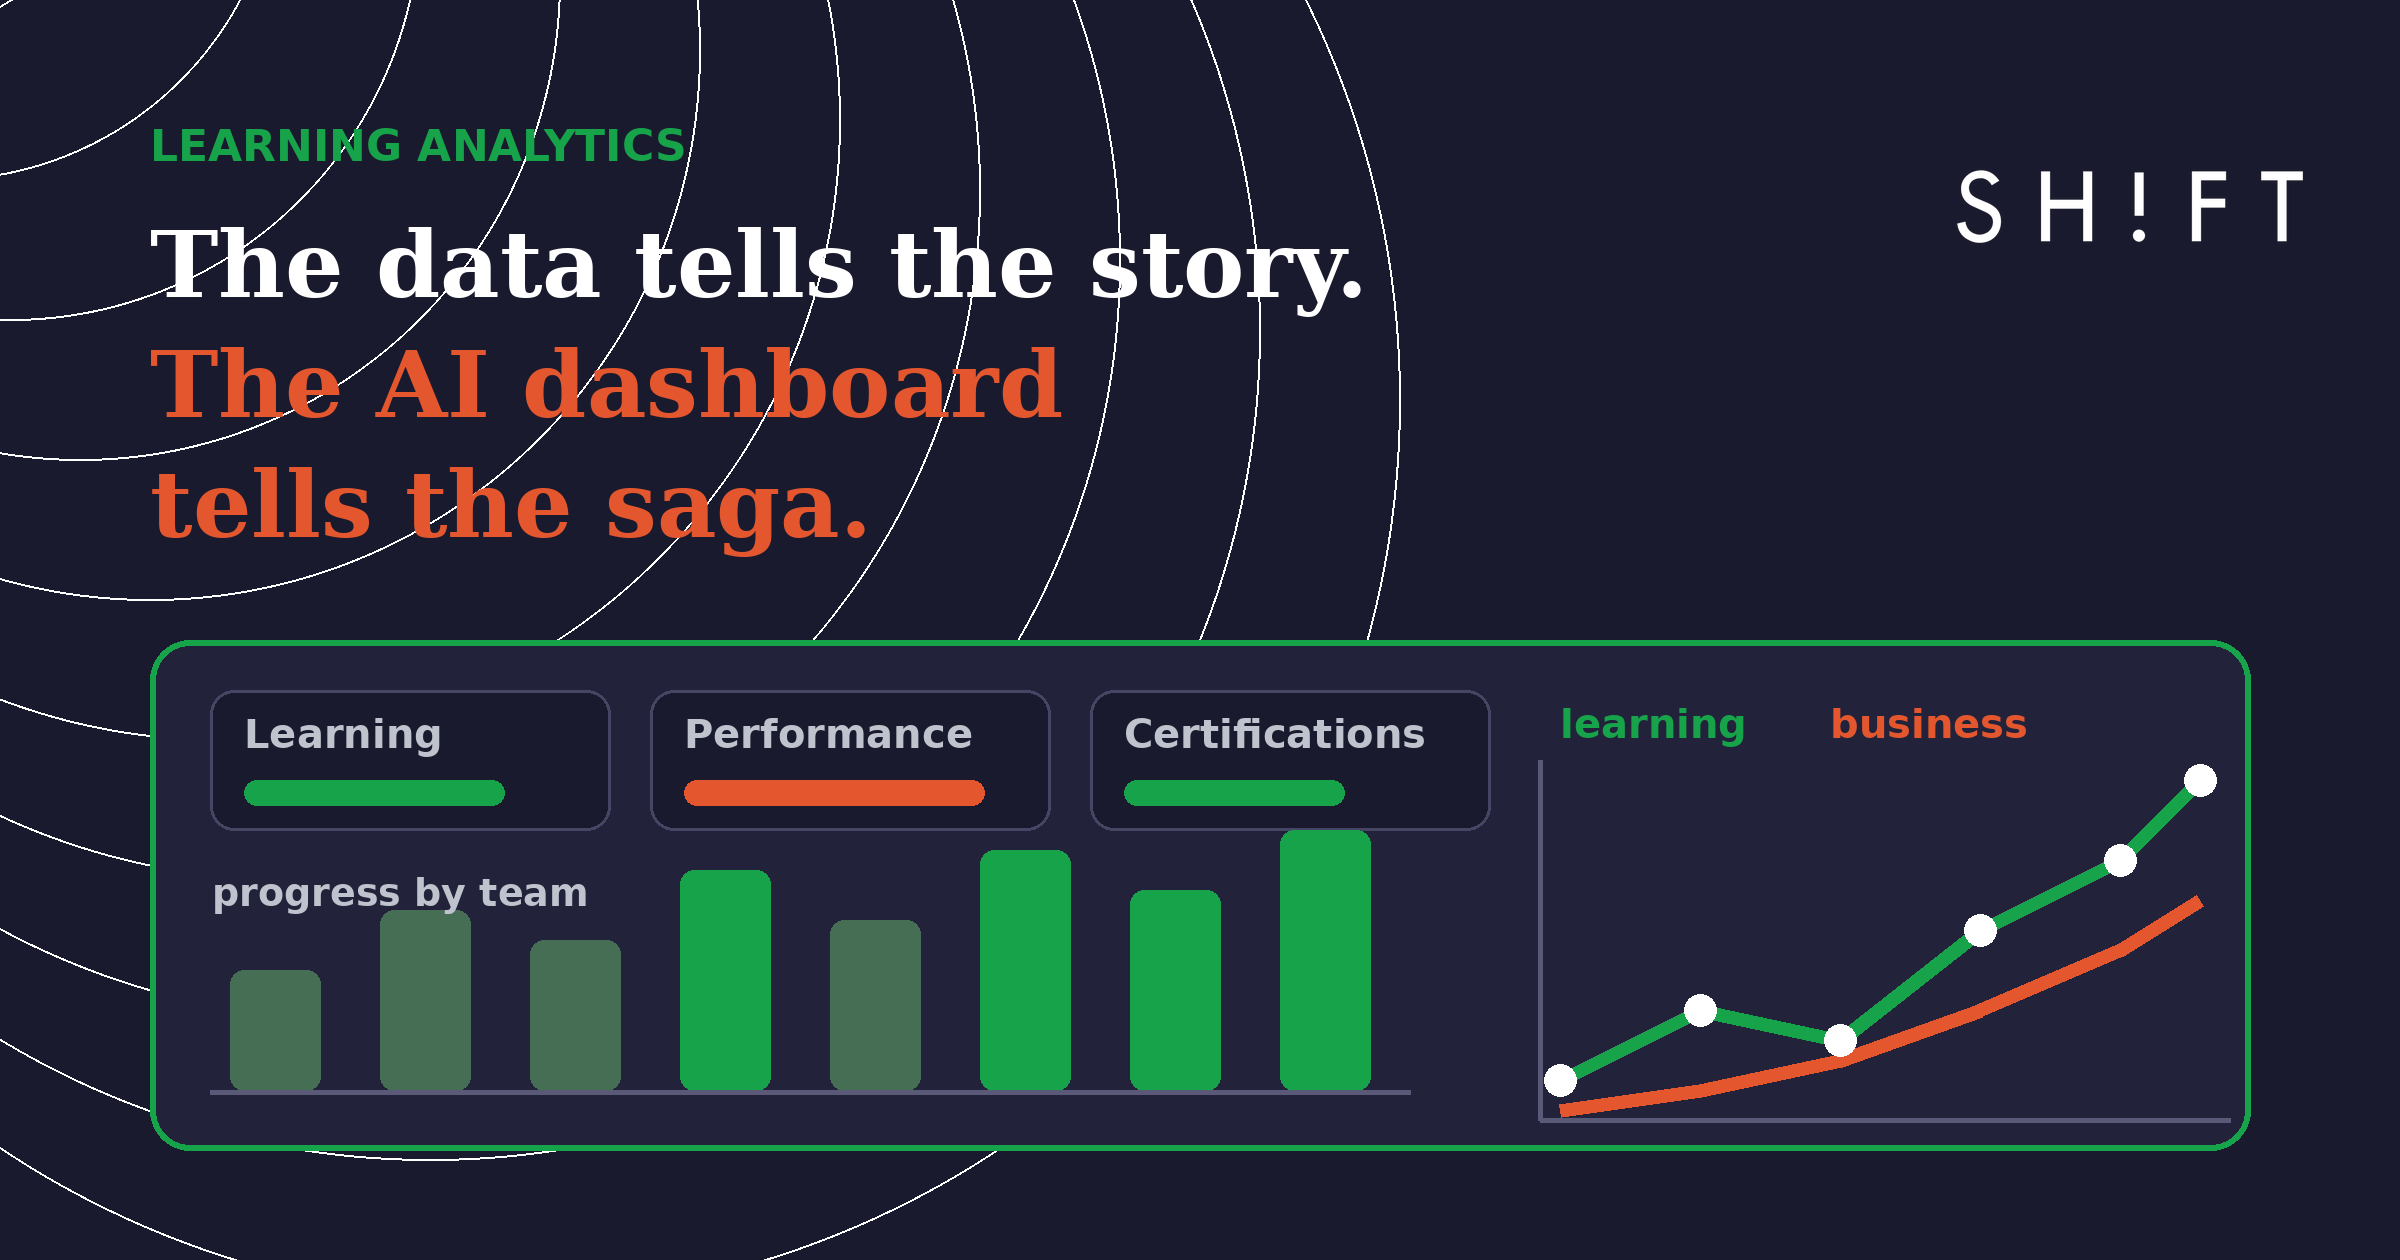
The data tells the story. The AI dashboard tells the saga.
A report tells you one chapter: who finished, who passed, what the scores were.
An AI-driven dashboard tells you the whole saga: it places learning data next to the other variables of your business and shows you how they move together over time. The teams that train and their results. Certifications and quality. Continuous learning and people's growth.
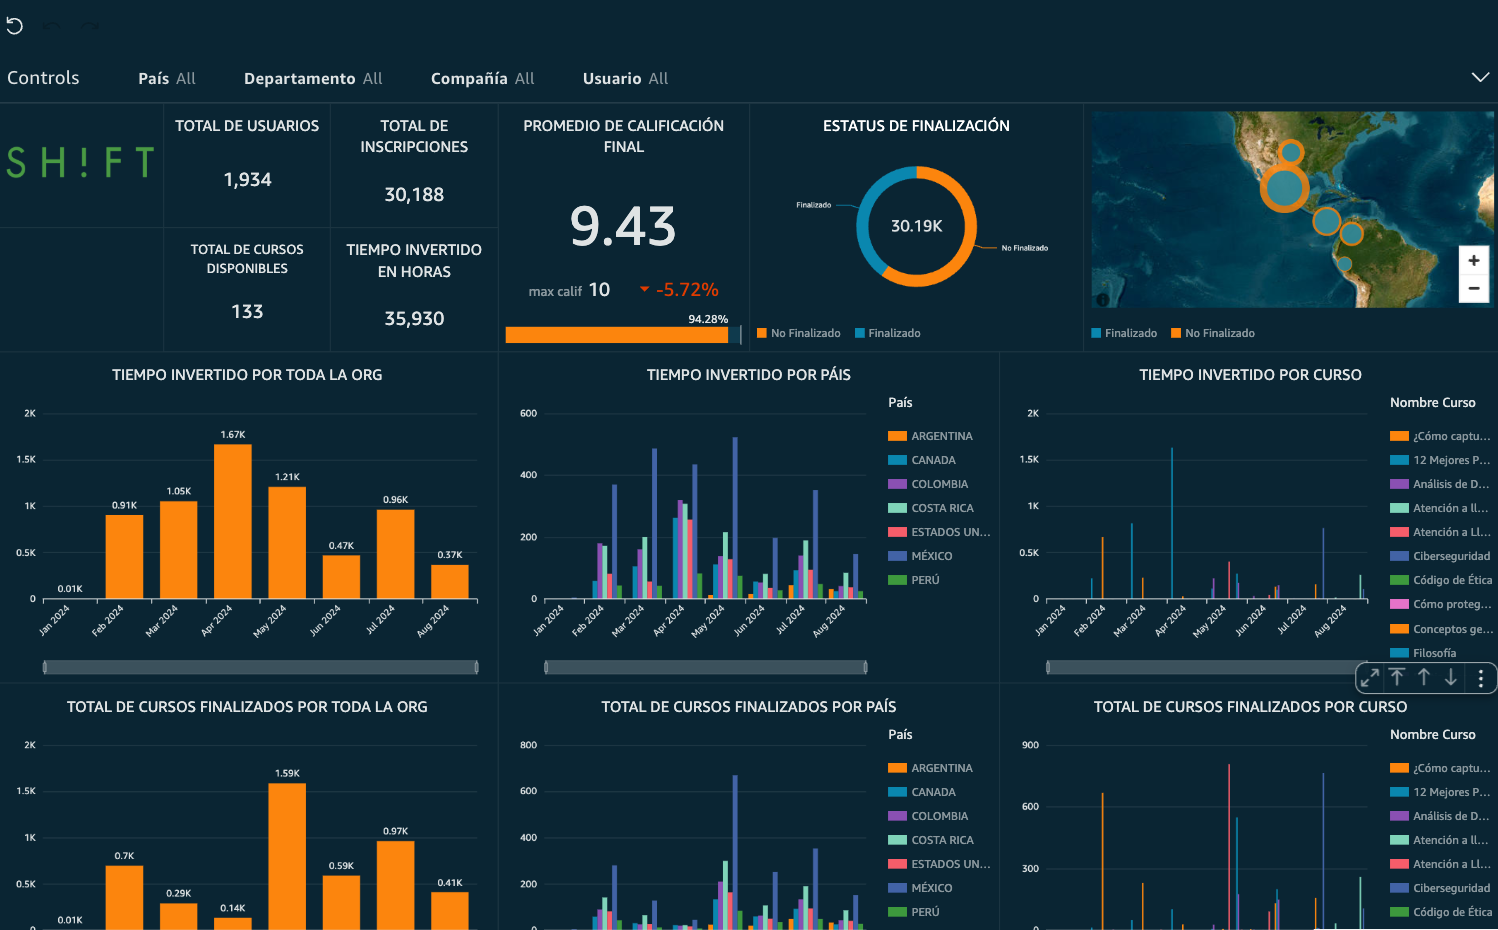
A real-time performance dashboard: the whole organization's learning, on one screen.
What kind of questions can that saga answer? For example:
When an interesting relationship appears on screen, the best business conversation begins: what is happening here? What learning opportunity can we create to push this result further? The patterns point the way; your team, who knows the context, confirms the cause and acts.
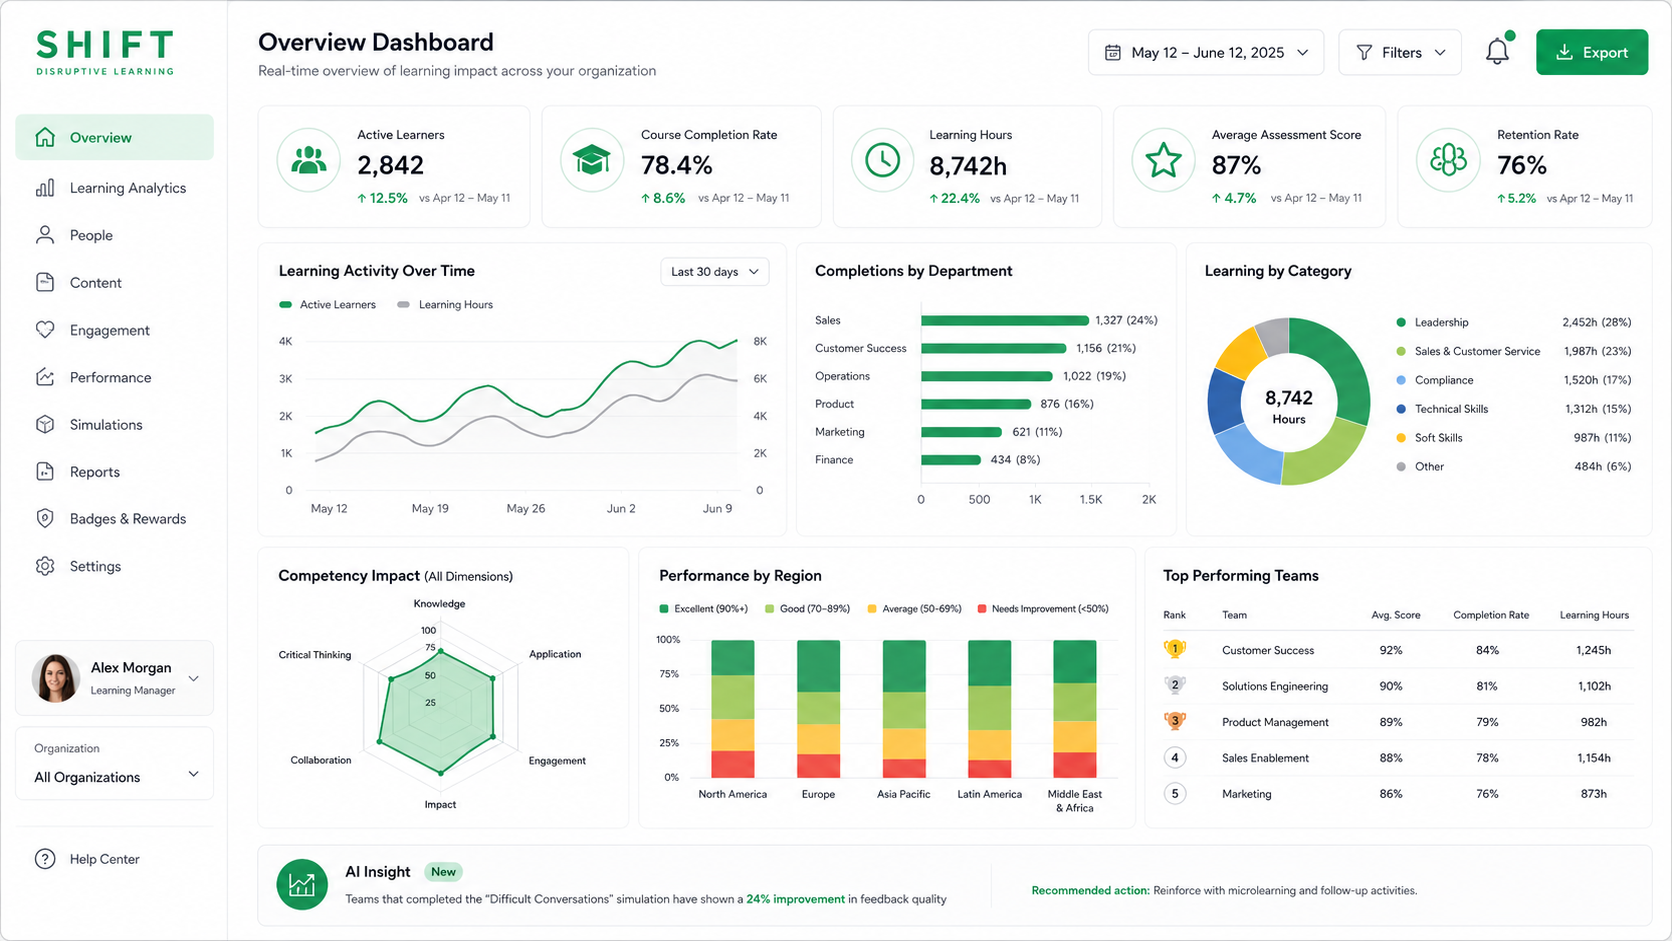
Hyper-segmented analytics: behavior by team, region, and profile — the detail behind the saga.
How to start this week
- 1Pick three business variables that matter. Sales, quality, service, retention — the ones your leadership team already reviews every month.
- 2Put them next to your learning data. On one screen. That single change turns training into a business topic.
- 3Book 30 minutes a month to read the saga. With your team. Look at the patterns, ask questions, choose what to explore.
- 4Decide one action per cycle. One course to reinforce, redesign, or create. Small, constant decisions build the big improvement.
Creating opportunities that improve performance
This is the final destination of all analytics: people who improve.
With clear signals, you can reinforce the exact topic a team needs, at the moment they need it. Bring everyone up to the level of your best. Spot the talent that is ready for more. And watch, loop after loop, how learning moves performance.
The future is bright: organizations that listen to their people through data, respond with timely learning, and grow together. It is not measuring for measuring's sake. It is measuring to improve lives and results.
What saga would your data tell?
The AI dashboards in the SHIFT ecosystem turn learner behavior into clear decisions. Creating eLearning since 1996, with 6+ million people trained across 43+ countries.
Explore the dashboardsReady to transform your corporate training?
See real results from companies that train with SHIFT — or talk to our team.