Visual content is attractive, stimulating, and much more interesting than just text. In eLearning, its an easy way to enhance content. When information is visualized, it can convey ideas simply; besides students these days are increasingly visual learners.
 We know you are probably thinking that you don’t have the time or skills to create graphics. Luckily, today there are so many amazing, user friendly tools that make great visuals, without needing any design expertise at all.
This post will definitely help you find new ways to explain complex and abstract concepts in your eLearning courses. We've collected 10 great tools for creating diagrams, infographics, flowcharts, charts and graphs easily and quickly.
Diagrams and flowcharts:
1. Creately:
This powerful online tool lets you make diagrams and flow charts very easily. When you start, you can choose from a number of diagram types and simply add your data to make your own chart. It has an user-friendly interface and many templates to choose from. Moreover, the end result looks very professional.
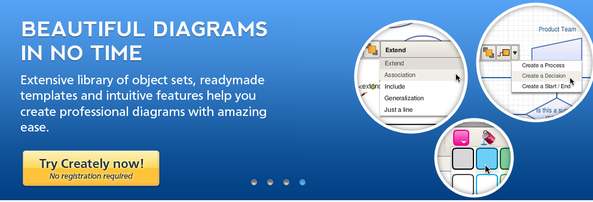
Take a look at these diagrams made with Creately.
2. Gliffy:
This online diagram editor makes it easier than ever to create great looking drawings. If you need to draw anything - flowcharts, process flows, technical drawings, diagrams, organization charts, floorplans - you owe it to yourself to check it out.
Charts and graphs:
3. Many-eyes:
Is the data visualization tool, powered by IBM. You are able to upload your own data or use data already available on the site to create graphs, pie charts, word trees, and word clouds. Afterwards, you can customize what your visualization will look like. The results are well-designed and very professional-looking.
Check out this link to see how to use the tool to build different types of interactive graphics.
Take note: You have to publish the visualization to download it, and all data entered into Many Eyes is publicly viewable, so don’t put confidential company info into it.
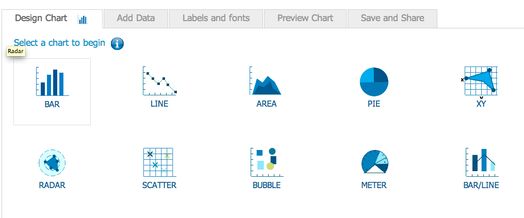
4. OnlineChartTool:
Creates online graphs and charts. What we love about this tool is that its extremely easy to use. In fact, after completing a few steps which consist of selecting a graph type, entering data and choosing colors and fonts, users can download the finished product in any of the following formats: png, jpg, pdf and csv. You can choose from 10 chart types, choose different charts style and even customize labels and fonts.
5. LovelyCharts:
It's a super easy "drag & drop" diagram creation editor. It allows you create chart and diagram directly on your web browser. This tool will help you create flowcharts, sitemaps, network diagrams, people diagrams, basic symbols, and wireframes.
Online photo editors:
6. Pixlr:
is an online photo editor that allows you to edit, adjust and create your own charts, infographics, and images for free. No registration required, just jump right in. This is a great tool to have at your disposal for those times that you need a photo editor but aren’t at your usual work station and don’t want to use Paint. It has the ability to save created images as a JPEG, PNG, BMP, TIFF or PXD to your computer, Flickr, Picasa and Facebook.
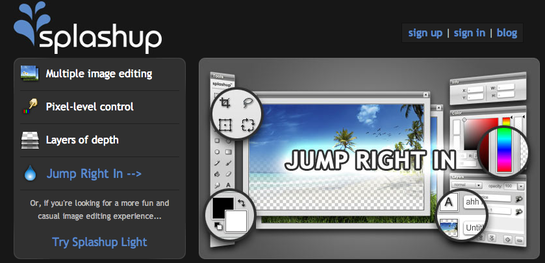
7. Splashup:
You won't need Photoshop when you can have splashup. This is online photo editing tool is very similar to Adobe's Photoshop. It offers up a very complete package of image editing tools. You can add layers, layer effects, filters, brushes and shapes to name a few. You can save your images locally and continue working on them later on. Even better, you can you can start with a blank image or import your pictures from Picasa, Flickr and Facebook.
Interactive timelines:
8. Dipity:
Timelines are a great tool to organize data in a chronological order. Dipity lets you create interactive and visually engaging timeline in minutes. Once created, they can be embedded in websites and courses to add an interactive and engaging element. You can even pin markers on important dates to include photos, links, audio/video, and other forms of media.
Infographics:
9. Piktochart:
Piktochart enables you to turn boring data into engaging infographics easily. The application lets you do modify color schemes and fonts, insert pre-loaded graphics and upload basic shapes and images. It offers both free and paid versions. For beginners, the free version offers six free themes. If you want to make use of the 100+ themes available (and customizable), the paid version is just $29 per month.
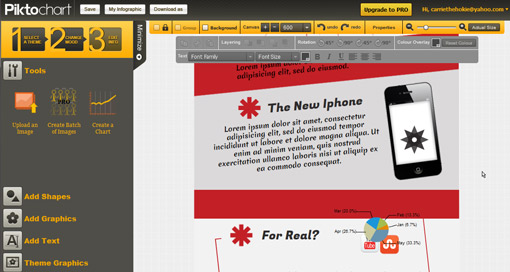
Image creation:
10. PowerPoint:
This famous presentation tool can also work as an image creation tool for eLearning. You can copy and paste photos, add shadows, create transparent shapes, and then group it all together and save it as a picture. It’s easy, and you don’t need to be a graphic design expert. Whether starting from scratch or purchasing a photo to build off, PowerPoint is a secret design weapon.
Check out this post and learn some ideas for creating graphics in PowerPoint.
So, visualize your content, get creative and you‘ll be amazed how learners will love your courses!
Data visualization tools are being used more and more to help eLearning developers illustrate complicated data that would be boring if presented in a simple chart or spreadsheet. It is highly recommended you convert numbers and facts into interesting, engaging and useful visual elements beyond what learners commonly see in other courses.