SHIFT's eLearning Blog

Our blog provides the best practices, tips, and inspiration for corporate training, instructional design, eLearning and mLearning.

To visit the Spanish blog, click here

    A 5-Step Guide To Creating Compelling Infographics of Your Own

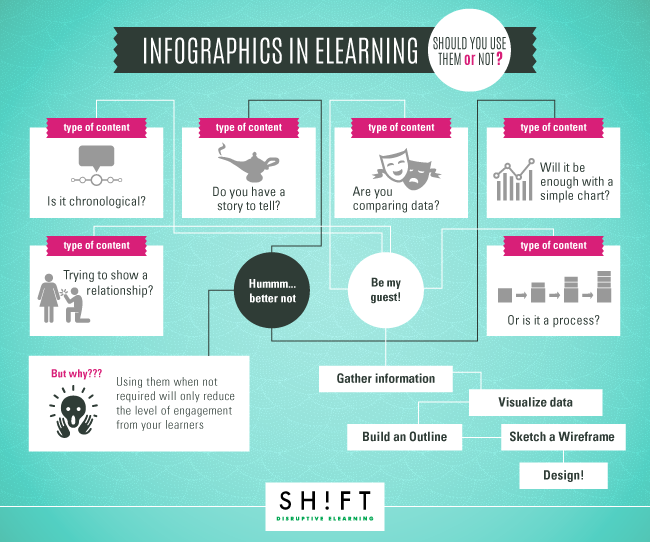
    Attractive, compelling, easily consumable —People have come to love Infographics. They simplify data and makes consuming them easier. They are exciting! And they jazz up your eLearning course like few other elements can!

    Infographic: Learning Analytics 101

    According to this recent infographic by Open Colleges, Learning Analytics can leverage education data and have a true impact on student’s educational experience. Learning Analytics goes beyond just tracking; it dives into each student’s interactions, analyzes their performance, makes the learning process very personalized and understand the learner’s responte to course content.

      Related Posts

      Are Your e-Learning Programs Hitting the Mark? Let’s Find Out!

      In the fast-paced digital landscape, eLearning isn’t just an option—it’s the backbone of modern corporate training. But if you're leading these initiatives, you know all too well the challenge of proving their worth. Let's face it, tracking course completions hardly scratches the surface. Does checking off boxes truly tell us anything about real success? It’s 2024, and it’s high time we rethink our metrics.

      Best Practices for Measuring the Impact of Online Training at The Workplace

      Are you truly maximizing the potential of your online training programs? As training leaders, you know it's tough to show how effective your learning initiatives are. Often, it's hard to see the real impact these programs have.

      Golden Rules for Using AI to Supercharge E-Learning Content Development

      Artificial Intelligence (AI) is reshaping the landscape of e-learning course development.