
Every training budget hides the same question: is it worth it? Executives rarely doubt that training matters — they doubt that the money spent on it comes back. The honest answer is that it depends on a handful of numbers you already have, and on one concept borrowed from finance: return on investment. This article explains how training ROI actually works, walks through every variable that drives it, and then hands you the controls — an interactive calculator, right inside this post, followed by a worked example you can compare against your own program.
What ROI means when the investment is training
Return on investment is a simple ratio: the value an investment produces, minus what it cost, divided by what it cost. If you spend $10,000 and get $30,000 of value back, your ROI is 200% — you recovered your money and doubled it on top.
Training complicates this in one specific way: the "return" is mostly avoided cost rather than new revenue. When you compare eLearning against classroom delivery, the return on the eLearning investment is everything you no longer pay for — instructor sessions, travel, venues, printed materials, and above all the extra hours employees spend away from their jobs. That makes the comparison unusually concrete. You are not estimating soft benefits; you are comparing two invoices for the same outcome: a trained workforce.
The second concept that matters is the difference between fixed and variable cost, because the two delivery models sit at opposite ends of it:
- Classroom training is almost entirely variable. It costs relatively little to schedule the first session, but the cost repeats every single time you run one. Double the learners, roughly double the bill.
- eLearning is almost entirely fixed. It costs more up front to build the course, but once built, delivering it to learner number 1,000 costs nearly the same as delivering it to learner number ten.
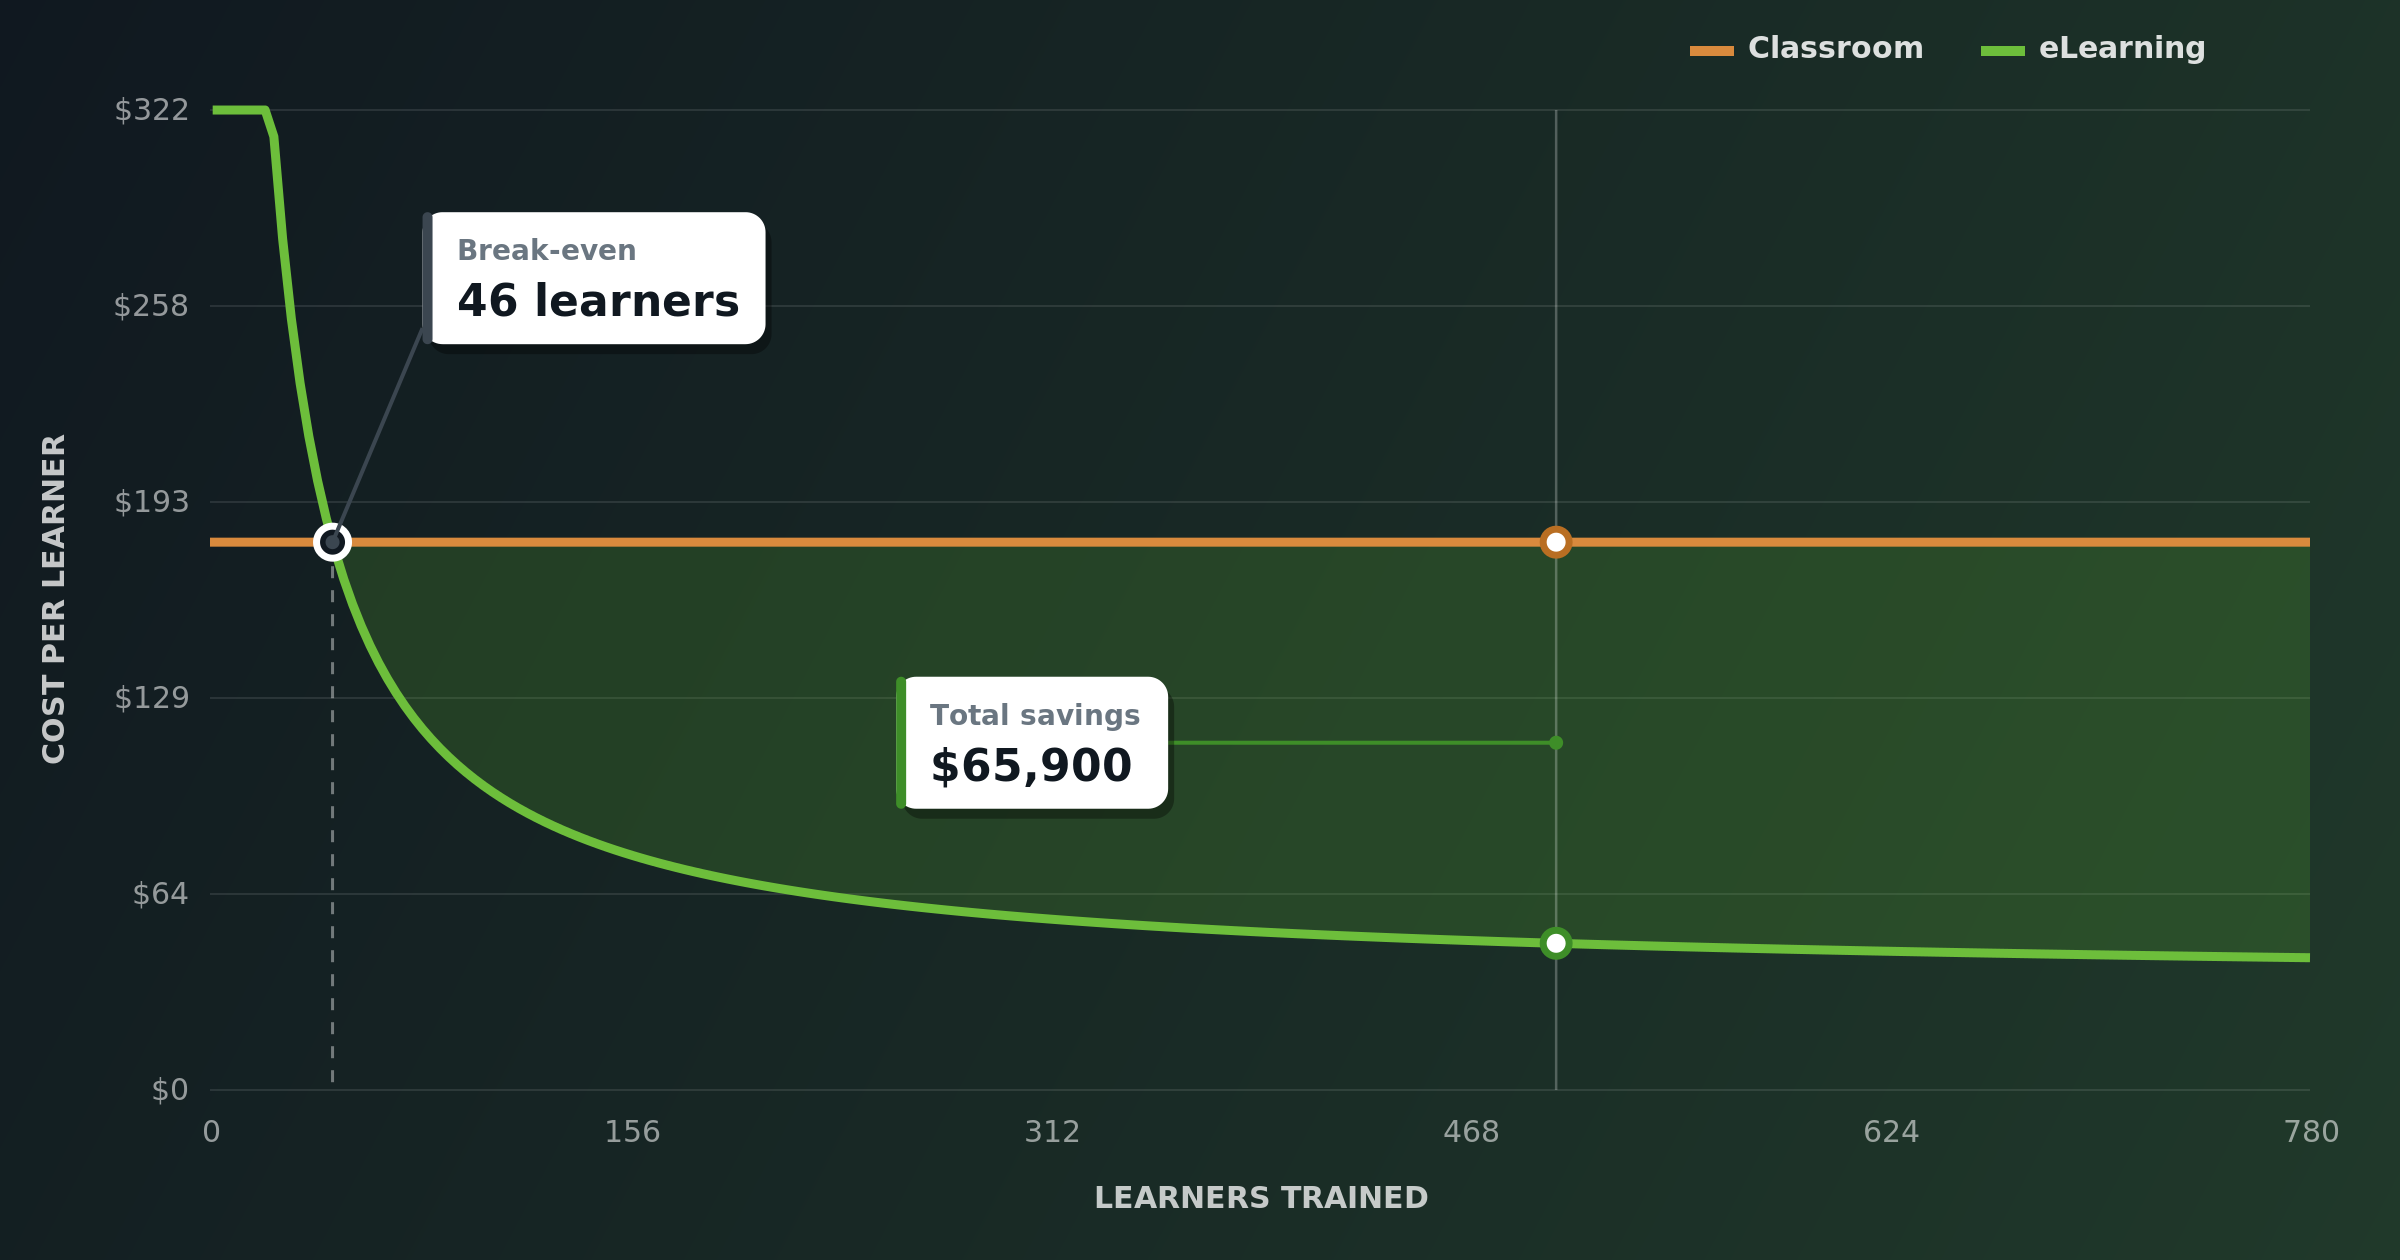
Plot both cost lines against the number of learners and they cross. That crossing is the break-even point: the number of learners at which eLearning stops being the expensive option and becomes the cheap one. Everything to the right of that point is savings — and the whole executive decision comes down to one question: is your training population to the left or the right of it?
The variables, one by one
The calculator below uses nine inputs. None of them are exotic — every one is a number your finance or HR team can pull today. Here is what each one means and why it moves the result.
Your program
- Learners to train. The single most powerful variable. Because eLearning's cost is fixed, every additional learner spreads the build cost thinner. Small audiences favor the classroom; large or recurring audiences favor eLearning.
- Loaded cost per learner-hour. What one hour of an employee's time actually costs the company — salary plus benefits and overhead, divided by working hours. This is the price of taking people off the job to train them.
- Count time off the job. A toggle. Many quick estimates ignore employee time, which flatters the classroom (its courses are longer). Turning it on gives the truer picture: seat time is a real cost on both sides.
Classroom training — costs that repeat every session
- Instructor cost per session, including preparation time. Whether it's an external facilitator's fee or an internal expert's loaded time, it is paid again for every session run.
- Travel and logistics per session. Flights, mileage, hotels, per diems — for the instructor, the learners, or both. Often the most underestimated line in distributed organizations.
- Venue, materials and food per session. Room rental, printed workbooks, catering. Small per session, meaningful when multiplied.
- Group size per session. How many learners fit in one session. This divides the three costs above across heads: bigger groups make the classroom cheaper per learner, but quality and scheduling usually cap the number.
- Course duration in hours. How long each learner sits in the room. Multiplied by the loaded hourly cost, this is the classroom's time-off-the-job bill.
eLearning — costs that are paid mostly once
- Development cost per finished eLearning hour. What it costs to design and build one hour of finished digital course — whether produced in-house or by a partner. This rate varies widely with interactivity and media richness, and it is the number that modern AI-assisted authoring is pushing down fastest.
- Time savings versus the classroom. Self-paced digital courses consistently need less seat time than the equivalent instructor-led session, because they cut travel, introductions, group pacing and repetition. The calculator lets you set this compression yourself rather than assuming a number for you.
- Annual maintenance. Fixed at 10% of the build cost per year in this model — content updates, fixes, small refreshes. Courses are assets; assets need upkeep.
From these, the model derives everything else: the eLearning course duration, the one-time build cost, the total cost curves, and the break-even point.
How executives should read the results
Three numbers on the calculator matter more than the rest, and each maps to a different decision.
1. The break-even point — the go/no-go signal. If break-even is at 46 learners and you need to train 500, the decision is not close: the classroom is costing you money you can count. If break-even is at 400 and you train 80 people once, the classroom wins and you should keep it — or look for ways to lower the build cost until the line moves. Break-even turns a philosophical debate ("should we digitize training?") into an arithmetic one.
2. Cost per learner — the scaling signal. Classroom cost per learner is flat: the 500th learner costs the same as the first. eLearning cost per learner falls with every additional person trained. Executives planning growth, acquisitions, seasonal hiring or high-turnover operations should weight this heavily: the delivery model you choose today sets the slope of your training costs for years.
3. Total savings at your volume — the budget signal. This is the number for the CFO: at your actual headcount, the gap between the two curves is money that either stays in the training budget (to build more courses) or returns to the business. It is also the honest basis for an ROI figure: savings divided by what you invested.
Two cautions belong in every executive conversation. First, the model compares delivery costs for the same outcome — it deliberately does not assume eLearning teaches better or worse, so it will not inflate your case with soft benefits. Second, run the sensitivity check: drag each slider to its pessimistic end and see whether the conclusion survives. A decision that holds when development costs 50% more than you hoped is a decision you can defend in a board meeting.
Try it with your own numbers
The calculator below is live — move any slider and the curves, break-even point and savings update instantly. Switch between Total cost and Per learner to see both views of the same story. (Prefer a full-screen version? It also lives on our site as the Interactive ROI Calculator.)
Your program
Who you're training, and what an hour of their time is worth.
Classroom training
Cost repeats every time you run a session.
eLearning
Cost is mostly up front — then it scales for almost nothing.
Cost per learner as you scale
This model uses only the numbers you enter — no assumed savings rate. Classroom cost scales with the number of sessions (learners ÷ per session) plus each learner's time in the room. eLearning is a one-time build plus annual maintenance plus each learner's — usually shorter — seat time. Real programs vary; treat this as a directional business case, not a quote.
A worked example: ACME Inc.
ACME Inc. is a composite, illustrative company — the numbers below are the calculator's own output for the inputs shown, not a client result. In fact, they are exactly the default values you see in the calculator above, so you can verify every figure yourself.
ACME is a mid-size services company that must put 500 employees through a recurring 2-hour compliance course. Their inputs:
| Input | Value |
|---|---|
| Learners to train | 500 |
| Loaded cost per learner-hour | $35 |
| Instructor cost per session (incl. prep) | $1,200 |
| Travel & logistics per session | $600 |
| Venue, materials & food per session | $400 |
| Group size per session | 20 |
| Classroom course duration | 2 hours |
| eLearning development cost per finished hour | $6,000 |
| eLearning time savings vs classroom | 50% (→ 1-hour course) |
What the model returns
- Classroom, all-in: each session costs $2,200 ($1,200 + $600 + $400) for 20 people, or $110 per learner — plus 2 hours of paid time per learner ($70). Total: $180 per learner, $90,000 for all 500.
- eLearning, all-in: a one-time build of $6,000 (1 finished hour × $6,000), plus $600 annual maintenance, plus 1 hour of paid seat time per learner ($35). Total: $24,100 for all 500 — about $48 per learner.
- Break-even: 46 learners. From the 46th person trained, eLearning is the cheaper path; ACME's population is more than ten times that.
- First-year saving: $65,900 — roughly 73% less than classroom delivery. Measured as return on the eLearning spend, that is about $2.70 recovered for every dollar invested, in year one alone.
Where it gets more interesting: year two
Compliance training repeats. Next year ACME trains another 500 people — but the course is already built. The eLearning bill drops to maintenance plus seat time: about $18,100 versus $90,000 for another classroom round — an 80% saving that recurs every cycle. This is the pattern executives should internalize: classroom costs repeat in full; eLearning costs repeat at a fraction. The first year decides whether the investment pays; every following year is where it compounds.
And ACME's board can stress-test the decision in seconds: even if development had cost double ($12,000 per finished hour), break-even would still sit at 92 learners — far below their 500. The conclusion survives pessimism, which is exactly what makes it defensible.
Turn the curve into a plan
The calculator tells you whether and when digital training pays for itself. The next question is how — what it takes to build courses at a cost per finished hour that keeps your break-even low, deliver them to every team, and prove the results to your leadership. That is what we do: for nearly three decades, organizations in more than 43 countries have trained over 6 million people on our eLearning ecosystem.
Bring your numbers to a live session and we'll map them to a real rollout — content production, delivery and measurement in one place. Request your demo, or keep exploring with the full-page Interactive ROI Calculator.
Ready to transform your corporate training?
See real results from companies that train with SHIFT — or talk to our team.