 Graphics for eLearning: Which One Should I Use?">
Our brains are wired to learn visually. It’s a proven fact backed by science. And it’s an untapped opportunity for eLearning course developers. The problem is not the lack of resources; there are tons of graphics for eLearning available online. The real problem lies in effectively (that is, strategically) selecting resources appropriate to your material. Choosing the right graphics is fundamental because those with no purpose can actually make learning harder.
You’ll know a visual element is appropriate if it serves a specific goal. Course developers can start by identifying both the surface and functional features of a graphic. We all know what surface features are. In fact, many of us think of visuals in terms of their salient appearance. Is that a drawing? A GIF or moving image? A photograph? While surface features are important, functional features are what determines the effectiveness of an eLearning course. They include the communication and psychological functionalities of a graphic, and you better pay attention to them when designing your material.
There are different types of images we can use, depending on the kind of information we have. To help you answer the common question: "If I use graphics, which one should I use?" here are six categories of visuals according to the Educational Psychology Review:
1. Decorative
While this type of graphics adds aesthetic appeal and humor to a material, you should sparing use them in your eLearning materials. Decorative pictures are completely ignored by learners. They don’t serve any instructional purpose. Used excessively, such as when theming your course, they can depress learning rather than facilitate or improve it.
2. Representational
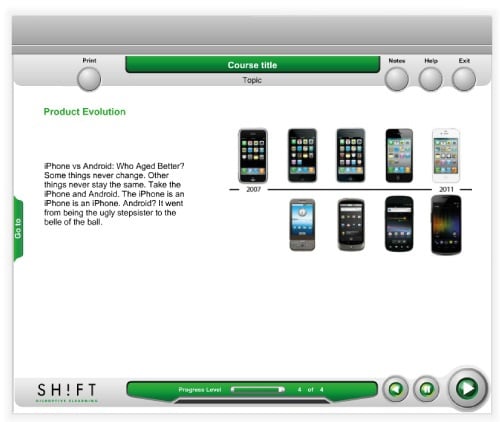
This type is commonly found in training materials. As the name suggests, it’s intended to depict a lifelike image of an object. They usually have a strong connection with the text on the screen-- they reflect and reinforce it. Photographs of people undertaking tasks, photos of equipment and screen captures are just some examples of representational graphics. You can appropriately use them when showing factual information and concrete concepts.
3. Organizational
Want to guide learners through course content? Or perhaps visually orient them to the sequence of a lesson? Organizational graphics are your best choice. These images can be very helpful to the learner because they help to build mental models and to organize the knowledge in ‘scaffolds’. By showing overviews of the content, they’ll help walk students through the main ideas of your eLearning material. Often geometric visuals are used as the basis for organizational graphics. Some examples: a process flow chart, venn diagrams or site maps.

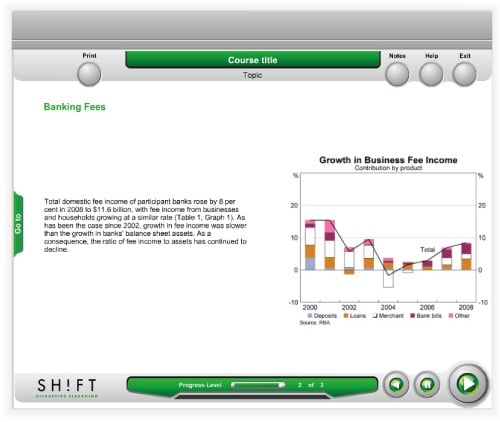
4. Relational
While organizational graphics show the qualitative relationship of your material’s contents, relational graphics depicts their quantitative relationship. You’ll see them often as line graph and pie charts. They’re powerful visuals that make easily digestible content out of numbers.
5. Transformational
Transformational graphics are often combined with other types of visuals to show changes in an object over time. Animation is the most commonly used form, but you can also use before and after photographs or illustrations, demonstration of how something is affected by a process, if adding videos can slow down your eLearning course.
 Tip: Procedural instructional goals work best with a combination of transformational and representative visuals to demonstrate procedures.
6. Interpretative:
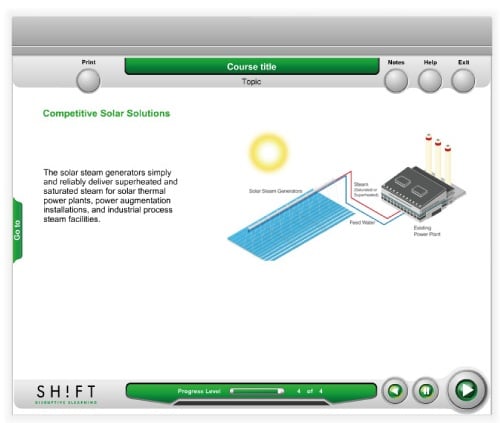
This type of graphics will help learners better understand abstract ideas. They illustrate a theory or principle. For instance, you can use simulations, diagrams of equipment working, series of graphics showing something working, animations or even simple line drawings to explain scientific laws and theories and help learners understand them conceptually.
Choosing the best graphics for eLearning starts with determining your instructional goals. Chose one or two categories of graphics that align with each of your goals. For instance, course materials heavy on processes can benefit a lot from a combination of transformational and interpretive graphics. Those made of multiple facts can benefit from relational and organizational graphics.
Make your next elearning course more effective by choosing the right graphics. Visualize your screens and use graphics that explain the content, not that just make your course look pretty.
Do your visuals offer functional features? Or are they mere eye candies? Carefully decide which category best serves your purpose.


Ready to transform your corporate training?
See real results from companies that train with SHIFT — or talk to our team.