Although infographics, charts, illustrations, and other visuals for eLearning will never replace quality content, they can often do a better job at explaining content easily. However, in order to become effective teaching tools, visuals must reflect the user’s cognitive architecture and add something meaningful to the learning experience.
It is important that eLearning professionals decide, during the planning stage, whether an image should be supplementary or act as a substitution for content. This enables developers to design and use visuals in a way that will help students select, organize, and integrate relevant information while avoiding cognitive overload.
This post looks at a simple approach to creating effective visuals for eLearning by considering the 5 Cs. The approach is designed to help developers decide when they really need to include images and to avoid adding images just for the sake of it.
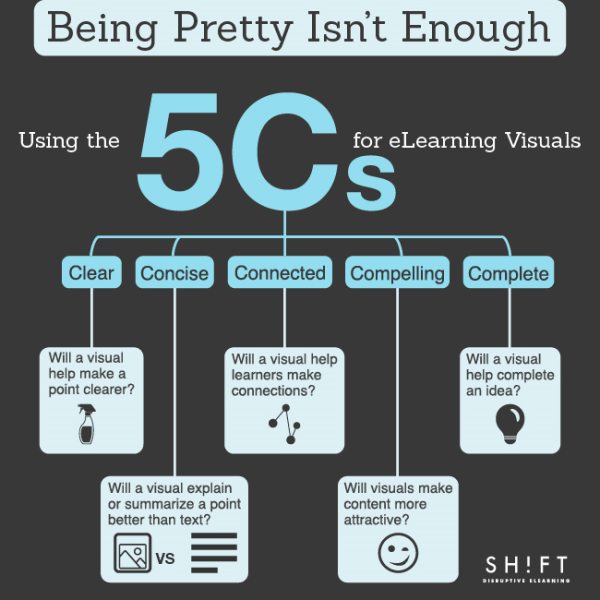
1. Clear — Will a visual help make a point clearer?
Once the eLearning developer has decided on what content to include in a module, it is time to plan how to convey this information. As people remember visuals better than words, it can be useful to consider presenting certain points with graphs, illustrations, and photographs. Many times, this will make content easier to scan and understand and ensures learners stay interested. Visuals also make information more manageable, reveal underlying patterns, and emphasize key points.
They help express complex or abstract ideas that would be difficult to explain through verbal or textual information. In fact, the more complicated the content is, the more useful visuals are in your eLearning course — visuals can make the abstract more concrete, the invisible, visible. Therefore, they eliminate the need for extensive explanations.
Anything that requires users to remember information, or make a decision may be better expressed by visuals. Every mental task the eLearning professional can eliminate for learner’s leaves more mental resources for essential decision making. So, designers should review and analyze their content first, and decide if there are better ways to express complex material in the form of visual content.
Example: Instead of using plain tables or screens full of boring numbers, turning data into a graphic makes it clearer and memorable.
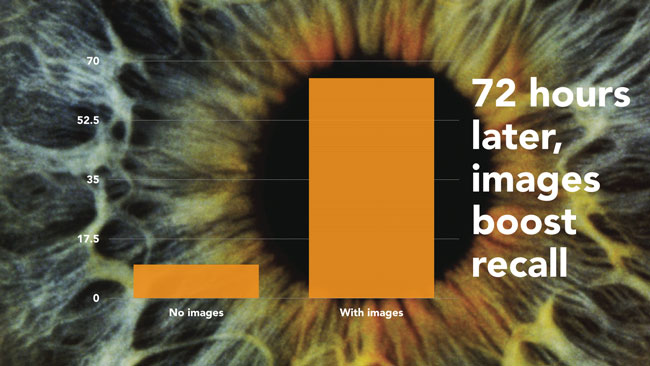
Image Source: BoostBlogTraffic
2. Concise — Will a visual summarize a point better than text?
For content that requires extensive description or explanation, it may be better to express details visually. Not only does this reduce the amount of content on-screen, it also helps the brain function with its limited information-processing resources.
Visuals enable eLearning developers to present all the information necessary for a topic in one single place. This helps the working memory to create hierarchies of information to reduce the number of details the mind needs to store. By storing a single visual representation in the working memory instead of all the individual elements, the learner can access the smaller aspects just when needed.
If developers can equally express a point through text and graphics, visuals are usually best because people prefer images and because vision dominates over other senses for acquiring perceptual information. Learners also have a larger capacity to remember images than text or audial information, increasing recall.
Example: This image summarizes the most important points in one single place.

Image Source: Knowledgeable Ideas Blog
3. Connected — Will a visual help learners make connections?
Visuals for eLearning help users see logical connections, including similarity, difference, correlation, and cause and effect, that would otherwise require explanation. Constructed graphics organize complex materials to highlight key features and show spatial relations between important aspects that learners are unlikely to deduce on their own.
The above is especially true when images are combined with visual language to depict meaning. Course designers should consider layout and placement of pieces of information as this is central to guiding learners through the story.
Visuals can involve lines, boxes, arrows, space, color, typefaces, and relative distance between elements to communicate the relationship between the different aspects. An eLearning developer would find it challenging to express this information through words alone. Therefore, whenever it is important for learners to understand that there is a connection between concepts, the developer should consider using a chart, diagram, mind map or other type of illustration.
 Image Source: Hampshire County Council
4. Compelling — Will visuals make content more attractive?
Today’s society is a highly visual world. eLearning developers need to think carefully every time they consider using a visual for eLearning to decide if it will really make the message more persuasive, interesting, and likely to be read. This not only means never adding visuals for purely decorative purposes but also being creative when choosing images.
Every picture must add something to the learning experience. Developers should choose interesting ideas that tell a story in a less obvious way in order to keep the audience engaged, reinforce professionalism, and make a lasting impression. Remember, graphics do not always need to be realistic; sometimes abstract ideas better illustrate an idea as a photorealistic image could distract learners with its irrelevant elements.
Example: You can use this type of images to represent a concept. Use images analogies to make your screens more visual.

Image Source: Eyes Wide Open
5. Complete — Will a visual help complete an idea?
Certain types of visuals for eLearning, such as tables, serve to complete the central idea by helping to narrow down material. In addition, they allow course designers to exclude details, by summarizing, concluding, or recommending, while staying out of the way of the main message.
Studies have shown that adding such graphical representations to a course can lead to better learning than text alone. However, these studies do emphasize that text descriptions should appear near visuals if they are to enhance learning.
Example: Take a look at how you can turn boring data table into a visually attractive screen.
 Image Source: 24Point